
When will interest rates go down?
Interest rates go down when the Federal Reserve's Federal Open Market Committee (FOMC) votes to cut the federal funds rate, which happens once inflation is moving back toward the 2% target and the labor market shows signs of softening. As of April 2026, the effective federal funds rate sits at 3.64%, down from a 5.33% peak reached in October 2023, and the Fed has been cutting in measured 25-basis-point steps since September 2024 (FRED FEDFUNDS).
The honest answer to "when" is: nobody knows the exact date, including the Fed itself. The committee makes its call meeting by meeting, based on data that arrives between meetings. What you can do is read the same signals the FOMC reads.
Why the timing question matters in practice: the federal funds rate sets the floor for almost every consumer borrowing rate in the United States. A 1-percentage-point cut can lower a 30-year mortgage payment by roughly $200 a month on a $400,000 loan, drop a credit-card APR from 24% to 23%, and shave thousands off the total cost of an auto loan. Reading the signals correctly lets you time refinancing, lock-ins, and major purchases.
What is the federal funds rate?
The federal funds rate is the interest rate that US banks charge each other on overnight loans of reserves held at the Federal Reserve. The FOMC sets a target range for this rate (currently 3.50% to 3.75%) and the New York Fed conducts open-market operations to keep the effective rate inside that range. Every other US interest rate, from credit cards to corporate bonds, prices off this benchmark.
What signals tell you interest rates are about to go down?
Three signals consistently lead Fed rate cuts: cooling inflation, a softening labor market, and a downward shift in the FOMC's own dot plot at the quarterly Summary of Economic Projections release. When all three move together, the next cut becomes likely; when one of them surprises in the wrong direction, the Fed waits.
The FOMC publishes a Summary of Economic Projections (SEP) four times a year, after the March, June, September, and December meetings (Federal Reserve). The SEP includes the famous "dot plot," where each of the 19 FOMC participants plots their projection of the appropriate federal funds rate at the end of the current year, the next two years, and the long run. The median dot is the closest thing to a forecast the Fed publishes.
Markets translate the signals into real-time probabilities. The CME FedWatch Tool uses prices from federal funds futures contracts to show the implied probability of a cut at each upcoming FOMC meeting (CME Group). When the implied probability of a cut at the next meeting climbs above 70%, the market is signaling that traders think the data has lined up.
Which data points move the FedWatch probabilities?
Three monthly releases dominate:
- Consumer Price Index (CPI), released around the 10th of each month by the Bureau of Labor Statistics. Core CPI (excluding food and energy) is what the Fed watches most closely.
- Personal Consumption Expenditures (PCE) price index, released two weeks after CPI. Core PCE is the Fed's official inflation target measure; the goal is 2% year over year.
- Nonfarm payrolls and unemployment, released the first Friday of each month. A surprise rise in unemployment or a downshift in monthly job growth historically pulls forward expected rate cuts.
When two of these three releases come in below expectations in the same month, market-implied cut probabilities for the next meeting typically jump 20 to 40 percentage points within minutes of the release.
When will mortgage, auto loan, and credit card rates drop?
Variable-rate consumer products like credit cards and HELOCs reprice within one billing cycle of a Fed cut, while new auto loans and refinanced mortgages take one to three months to reflect the move. The lag is not the Fed's; it is the lag between the Fed's policy rate and the funding cost lenders use to price each product.
The relationship runs through three different channels depending on the product:
| Product | Indexed to | How fast it reprices after a Fed cut |
|---|---|---|
| Credit card APR | Prime rate (= fed funds + 3 pp) | One billing cycle, usually within 60 days |
| HELOC | Prime rate | Same; almost immediate |
| New auto loan | Lender's funding cost + risk margin | 1 to 4 weeks; varies by lender |
| 30-year fixed mortgage | 10-year Treasury yield + spread | Days; can move BEFORE the Fed acts |
| Existing fixed-rate loans | Locked at origination | Never; you must refinance |
The mortgage case is the one most people get wrong. Fixed mortgage rates do not track the federal funds rate directly. They follow the 10-year Treasury yield, which is driven by inflation expectations, the term premium investors demand for holding long-duration debt, and global demand for US government bonds (Freddie Mac PMMS). If the bond market expects a string of cuts, the 10-year yield falls in advance and mortgage rates with it; if the bond market expects the Fed to hold longer, mortgage rates can stay high even as the Fed cuts.
Should you wait for rates to fall before borrowing?
That depends on the alternative. If you are buying a house, waiting six months for a rate that may or may not arrive often costs more in lost equity build and rising home prices than the rate move itself saves. The financial-planning rule of thumb is: lock when the math works at today's rate; refinance later if rates fall enough to recover the closing costs in fewer than 36 months. The Consumer Financial Protection Bureau publishes a calculator and worked examples that walk through the trade-off. Some debts cannot be repriced at all: a federal fixed-rate loan such as a Parent PLUS loan is locked by statute, so the only way to change its rate is to refinance privately.
How long do rate-cut cycles usually last?
Rate-cut cycles outside of recessions typically last 12 to 24 months from peak to trough, with cuts of 25 basis points spaced one or two meetings apart. Recession-driven cycles are much faster: the Fed went from 5.25% to near zero in 16 months during 2007-2008, and from 1.5% to near zero in two weeks during the pandemic emergency response of March 2020.
The chart below shows the effective federal funds rate from 2015 through today, including the zero-bound period of 2020-2021, the 2022-2023 hiking cycle (the steepest in 40 years), and the cutting cycle that began in late 2024.
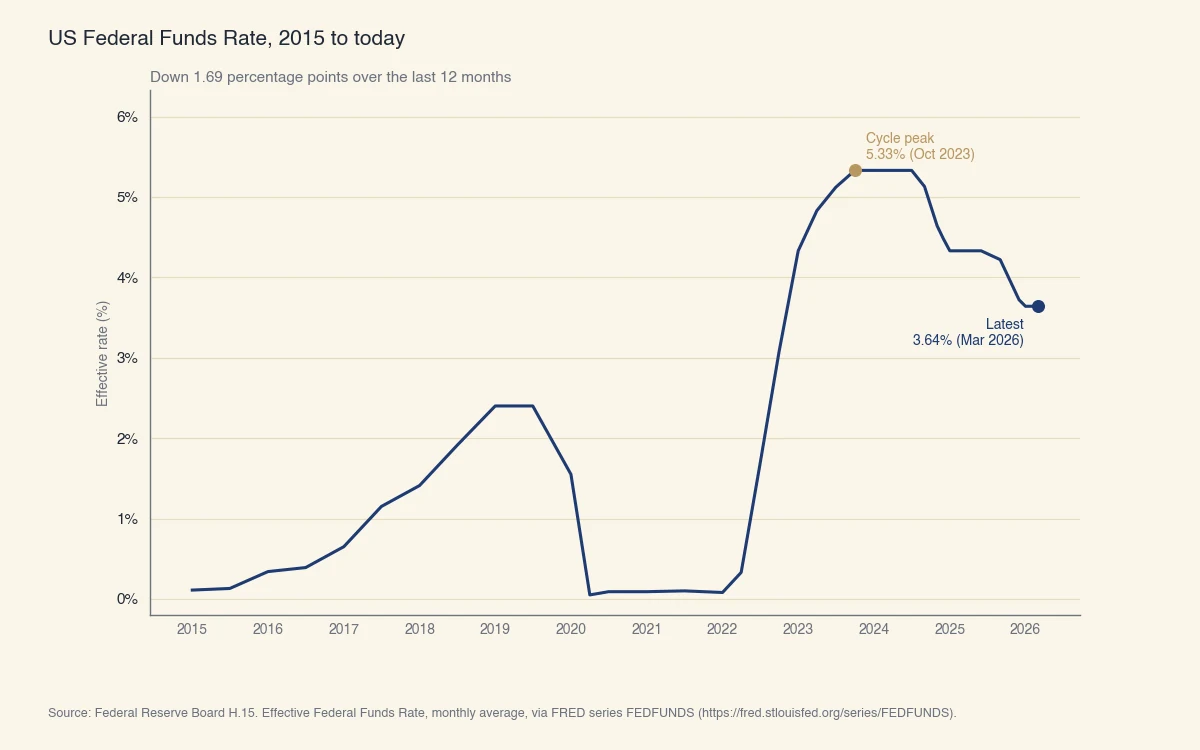
Source: Federal Reserve Board H.15. Effective Federal Funds Rate, monthly average, via FRED series FEDFUNDS (https://fred.stlouisfed.org/series/FEDFUNDS).
The historical pattern points to two takeaways. First, every cutting cycle eventually arrives at a "neutral" rate, defined as the rate that neither stimulates nor restrains the economy. The Fed's most recent SEP places this long-run neutral rate near 3%, which is the floor most participants project for this cycle absent a recession. Second, rate cuts are not a one-way trip. The 2018-2019 cycle cut three times and then paused; the 2007-2008 cycle paused after the first cut before resuming aggressively. Lock-in or refinance decisions should account for the possibility of a pause as well as continued cuts.
What is the long-run neutral rate?
The long-run neutral rate (sometimes written as r-star, or r*) is the federal funds rate that, in equilibrium, keeps inflation at 2% and the labor market at full employment. It is unobservable, so the Fed estimates it from models. The current FOMC median estimate is around 3% in nominal terms (1% real), up from a pre-pandemic estimate near 2.5% nominal. A higher neutral rate means a higher trough for cutting cycles.
Borrowers planning around a "rate floor" should plan for the Fed's stated long-run rate, not for zero. Zero rates were a feature of the 2008 financial crisis and the 2020 pandemic, not a baseline state.
How to read the dot plot in five minutes
The dot plot looks intimidating but contains only three numbers worth tracking:
- The median dot for the current year. This is the FOMC's best collective guess of where the federal funds rate ends the year. Compare it to where the rate sits today; the difference is the implied total of cuts (or hikes) still to come.
- The median dot for next year. This signals whether the cutting cycle continues or pauses. A flat or rising next-year median is the FOMC saying "we expect to stop here for a while."
- The long-run dot. This is r-star: the rate the FOMC believes is neither stimulative nor restrictive. The distance from today's rate to the long-run dot is the maximum room available for cuts before policy becomes accommodative.
The dispersion of the dots also matters. When the 19 dots cluster tightly, the committee agrees on the path. When they spread out across two percentage points, even the FOMC is uncertain, and forward guidance from the chair carries more weight than the median dot itself. If you are buying or refinancing now and not waiting on the cut, the discount-point buydown analysis covers when paying for a lower rate today is cheaper than holding out for the macro cycle.
A practical shortcut: read the post-meeting press conference, then check the dot plot. If the chair's tone differs from the median dot, the chair usually wins the next meeting.