

Are interest rates expected to go down?
Interest rates are expected to ease only slowly, not fall sharply. In its most recent projections, released June 17, 2026, the Federal Reserve's median policymaker expected the federal funds rate (the overnight rate the Fed sets, which anchors most other US rates) to sit at 3.8% by the end of 2026. That is slightly above the current target range of 3.50% to 3.75%, so the Fed's own central view implies no net cuts this year (Federal Reserve).
The larger declines the Fed projects come later. The same June 2026 projections put the median rate at 3.6% for the end of 2027 and 3.4% for the end of 2028, drifting toward a longer-run rate of 3.1% (the level the Fed believes neither speeds up nor slows down the economy). In plain terms: yes, rates are expected to come down eventually, but the path is gradual and measured in years, not months.
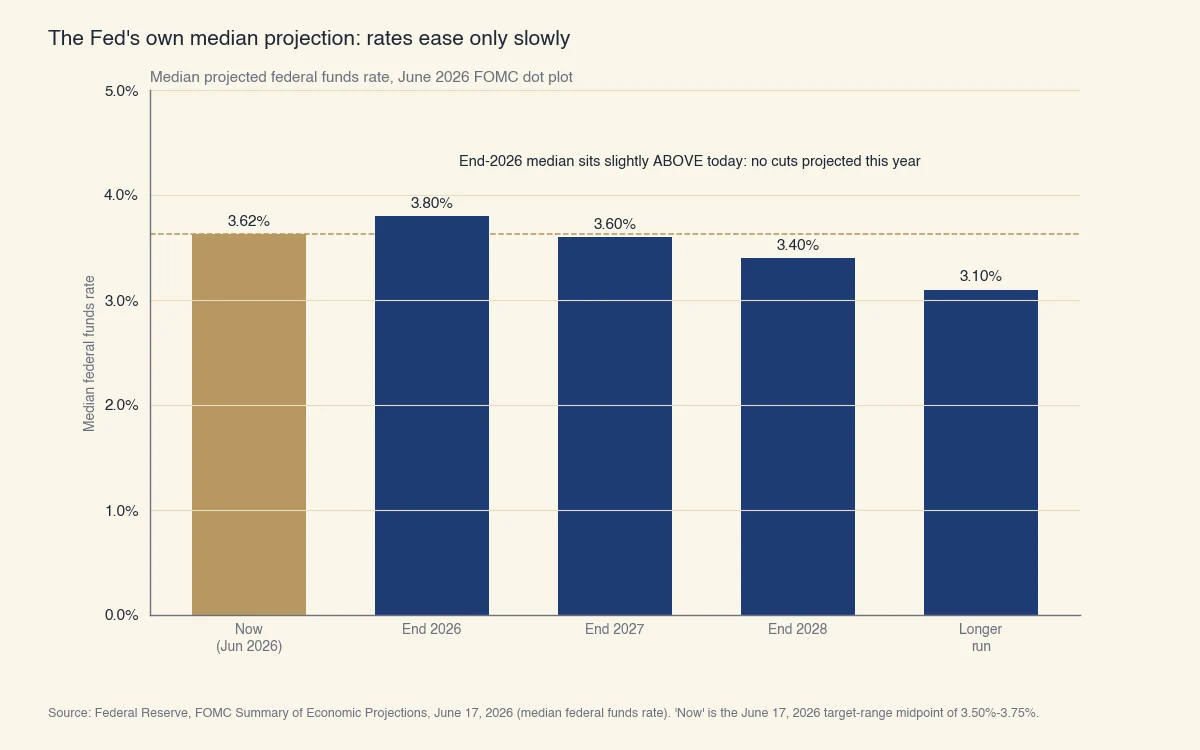
Source: Federal Reserve, FOMC Summary of Economic Projections, June 17, 2026. "Now" is the June 17, 2026 target-range midpoint of 3.50%-3.75%.
This is a hawkish shift from earlier in the year. In March 2026, the median projection for the end of 2026 was 3.4%, which implied a cut; by June, that median had risen to 3.8% because policymakers raised their inflation outlook (Federal Reserve). The direction of travel is still down over time, but the near-term expectation moved higher, not lower.
Why the shift matters for your decisions: the answer to "are rates going down" changed direction in three months without any new law or crisis, purely because the inflation data came in warmer than expected. That is the core reason to track the rate outlook yourself rather than trusting a forecast written months ago. The next two sections show you exactly how to do that, and how a change in the Fed's rate reaches the specific rate you pay.
How to see what markets expect yourself
Two free, public tools let you check the rate outlook directly instead of relying on any single forecast: the Federal Reserve's dot plot and the CME FedWatch Tool. Most articles hand you one prediction that goes stale the day rates move. These two sources let you re-check the answer yourself before every Fed meeting.
The Fed dot plot (Summary of Economic Projections)
The dot plot is a chart the Fed publishes four times a year, where each dot marks one policymaker's projection for the federal funds rate at the end of each year. Eighteen officials each place a dot, and the median dot (the middle value) is the headline number the news reports.
Here is how to read it:
- Find the column for the year you care about (for example, "2026").
- Locate the median dot, the one with an equal number of dots above and below it.
- Compare that median to today's rate. A median below today means the group expects cuts; a median at or above means no cuts, or even a hike.
- Look at the spread of dots. A tight cluster means agreement; a wide scatter means genuine uncertainty.
In the June 2026 projections, 8 of 18 officials placed their dot at the current level, 9 placed it higher, and only 1 lower, with the full range running from 3.4% to 4.4% (Federal Reserve). That scatter is the real story: the committee is divided, which is why forecasts disagree.
The CME FedWatch Tool
The CME FedWatch Tool shows the market-implied probability of a rate cut, hold, or hike at the next FOMC meeting, calculated from the prices of federal funds futures contracts (CME Group). Where the dot plot shows what policymakers say, FedWatch shows what traders are betting with real money.
Read it as a probability, not a promise. If FedWatch shows a 20% chance of a cut at the next meeting, the market is telling you a cut is possible but unlikely on that date. These odds update continuously as new inflation and jobs data arrive, so checking FedWatch a few days before a meeting gives you the freshest read available.
How does a Fed rate cut reach the rates you pay?
The Fed sets one overnight rate, and it flows to the rates you actually pay through different channels and at different speeds. Understanding that chain explains why a Fed cut can lower your credit card rate within a month while barely touching a 30-year mortgage.
The federal funds rate directly moves very short-term borrowing between banks. From there:
- Short-term and variable rates (credit cards, home equity lines of credit) track the prime rate, which moves in lockstep with the Fed. These reprice within a billing cycle or two.
- Long-term fixed rates (30-year mortgages) track the 10-year Treasury yield, which reflects where investors think rates and inflation are headed over years. These can fall before the Fed cuts, or rise after a cut, if the outlook changes.
- Savings yields (high-yield savings, CDs) follow short-term rates down when the Fed cuts, which is why savers earn less after cuts.
| What you borrow or save | What it tracks | How fast it moves after a Fed change |
|---|---|---|
| Credit card, HELOC | Prime rate (moves with the Fed) | Within 1-2 billing cycles |
| New auto loan | Short-to-medium rates | Weeks |
| New 30-year mortgage | 10-year Treasury yield | Can lead or lag the Fed |
| Existing fixed loan | Locked at signing | Never (rate is fixed) |
| Savings account, CD | Short-term rates | Weeks |
The practical takeaway: if you carry a variable-rate balance, a Fed cut helps you fairly quickly. If you want a lower mortgage rate, watch the 10-year Treasury yield, not just the Fed, because the bond market often moves first. A rate you have already locked never moves on its own, which is why whether parents can sign over a loan's interest rate comes down to refinancing it privately.
Are mortgage interest rates expected to go down?
Mortgage rates are expected to drift lower over time but stay elevated in the near term, with most 2026 forecasts keeping the 30-year fixed in the mid-6% range. Because mortgage rates track the 10-year Treasury yield rather than the Fed's overnight rate, they do not automatically fall when the Fed cuts (Freddie Mac).
Two points help set expectations honestly:
- Rates today are near their long-run historical average, not at an extreme. Since 1971, the 30-year fixed has averaged close to 7.8%, so a mid-6% rate sits below that long-term mean. The 2-3% rates of 2020 and 2021 were the historical anomaly, not the baseline to expect a return to.
- The dot plot is a current expectation, not a fixed schedule. The Fed itself stresses that its projections are not a committee plan and change as the economy changes. In past easing cycles, when the economy weakened quickly, the Fed cut faster and deeper than it had projected. A sharper slowdown could bring rates down faster than the June 2026 median suggests; persistent inflation could keep them higher for longer.
So the honest answer to "are mortgage rates going to come down" is: probably, gradually, but the timing depends on inflation and the bond market, and no forecast can pin the month.
What should you do while rates stay high?
Because the expected decline is slow and uncertain, base your decisions on your own timeline and budget rather than on waiting for a specific rate. A few grounded steps:
- If you carry variable-rate debt, focus on paying it down. You benefit automatically when rates eventually fall, and you cut interest cost now regardless of what the Fed does.
- If you are buying a home, decide based on whether the payment fits your budget today. You can refinance later if rates fall, but you cannot buy a house you could not afford in the first place.
- If you already have a mortgage, run the refinance math when rates move. A common rule of thumb is that refinancing is worth considering when you can lower your rate enough to recover the closing costs within the time you plan to stay in the home.
- If you are saving, lock longer-term CD rates while they are still elevated. When the Fed cuts, new savings yields fall, so today's rates may look attractive in hindsight.
The clearest signal to watch is inflation. The Fed cuts when it is confident inflation is returning to its 2% target, so each monthly Consumer Price Index report (BLS) and each jobs report moves the expected rate path more than any single forecast does. Track those two data series, read the dot plot after each quarterly update, and you will have a clearer, more current answer than any prediction headline can give you.