
Are mortgage interest rates going down?
Yes, gently. The Freddie Mac Primary Mortgage Market Survey reports the 30-year fixed at 6.36% for the week of May 14, 2026, down from a year-earlier 6.81% and from the October 2023 peak of 7.79%. Major forecasters cluster the rest of 2026 between 5.9% and 6.3%, with most calls drifting toward 6.0% to 6.2% by year-end (Freddie Mac, Bankrate).
A calibration before any practical advice: mortgage rates do not follow the Federal Reserve directly. They track the 10-year Treasury yield plus a mortgage-to-Treasury spread. That distinction matters because most consumers reading this question are hoping the next Fed cut will bring mortgage rates down. Sometimes it does. Sometimes, like September 2024, the Fed cuts and mortgage rates rise.
A quick definition before the chart. The Freddie Mac Primary Mortgage Market Survey (PMMS) is the canonical weekly average of the 30-year fixed-rate mortgage in the US. Freddie Mac collects rate data from thousands of loan applications submitted to Loan Product Advisor each week and publishes the survey on Thursday. The series goes back to April 1971.
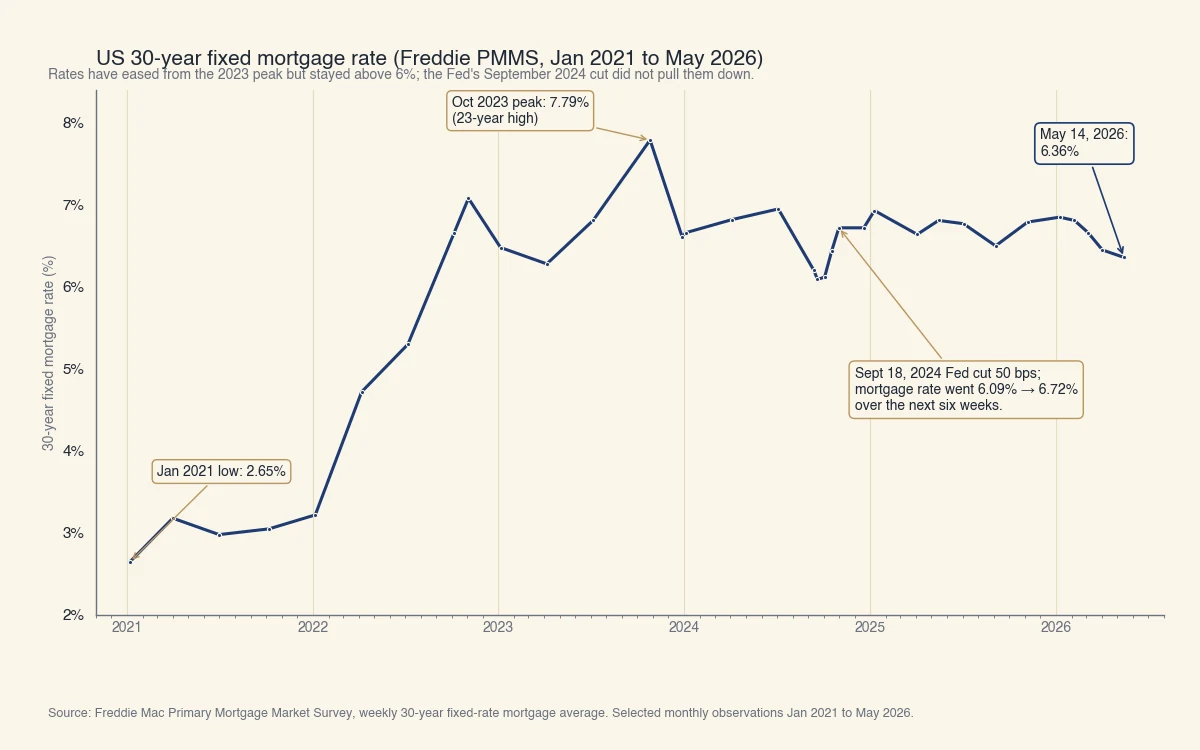
Source: Freddie Mac Primary Mortgage Market Survey weekly 30-year fixed-rate mortgage average. Annotations cite Freddie Mac PMMS and the Federal Reserve FOMC September 18, 2024 policy decision.
The chart shows the basic shape:
- The 2.65% record low in January 2021 was the bottom of a multi-decade decline driven by pandemic-era monetary stimulus.
- The 2022 climb added roughly 4 percentage points in 10 months as the Fed began the fastest tightening cycle in 40 years and inflation expectations re-priced.
- The October 2023 peak of 7.79% was a 23-year high. Most US borrowers who locked at that level have been candidates to refinance ever since.
- The September 2024 Fed cut is the moment the chart needs an annotation. The Fed cut 50 basis points on September 18, 2024. The 30-year fixed mortgage rate sat at 6.08% the week before. Six weeks later it was 6.72%, a 64-basis-point INCREASE despite the cut.
- The current 6.36% is a year-on-year improvement of about 45 basis points, modest but real.
Why don't mortgage rates follow Fed cuts directly?
Mortgage rates track the 10-year Treasury yield plus a mortgage-to-Treasury spread, not the Federal Reserve's overnight Fed Funds rate. The two can move in opposite directions, as they did in September and October 2024 when the Fed cut 50 basis points and the 30-year fixed mortgage rose from 6.08% to 6.72% (Bankrate).
The mechanism, step by step:
- The Federal Funds rate is the overnight rate banks charge each other for reserves. The Federal Reserve sets a target range and uses tools to steer the effective rate inside it. It is also the rate banks set their prime rate from, so see what the current prime interest rate is.
- The 10-year Treasury yield is the market's price for lending the US government money for 10 years. It moves on growth expectations, inflation expectations, and global capital flows.
- The 30-year fixed mortgage rate is the 10-year Treasury yield plus a mortgage-to-Treasury spread (sometimes called the mortgage spread). The spread compensates lenders for prepayment risk, credit risk, and servicing cost. It averaged 1.7 to 2 percentage points before 2020 and has widened to roughly 3 percentage points since.
The September 2024 example walks through the decoupling cleanly. The Fed cut Fed Funds by 50 basis points on September 18, 2024 (Federal Reserve). The 10-year Treasury yield was 3.65% the week before the cut. Over the following weeks, stronger-than-expected jobs data and persistent inflation pushed the 10-year up to 4.30%, and the 30-year fixed mortgage rose with it. The Fed cut and the mortgage market moved in opposite directions because they are measuring different things.
| Rate | What it represents | What moves it | Current level (May 2026) |
|---|---|---|---|
| Federal Funds | Overnight bank-to-bank rate | Fed FOMC decisions | ~4.25% to 4.50% target |
| 10-year Treasury | Cost of 10-year US debt | Growth, inflation, global flows | ~3.40% (varies daily) |
| 30-year fixed mortgage | Long-term home loan | 10-yr Treasury + mortgage spread | 6.36% (PMMS, May 14) |
| Mortgage spread | The gap mortgage minus 10-year Treasury | Prepayment risk, MBS demand | ~3.0% (vs 1.7-2% pre-2020) |
The practical takeaway: when an article or a news anchor says "the Fed cut, so mortgage rates will fall," it is conflating two different rates. The right question to ask is "what is the 10-year Treasury yield doing?" If you want to track where mortgage rates are heading next week, watch the 10-year, not the Fed.
Why has the mortgage-to-Treasury spread widened?
Three forces have kept the spread elevated since 2022. First, the Federal Reserve stopped buying mortgage-backed securities in early 2022 and began letting its MBS holdings run off, which reduced demand for the bonds and widened the spread that lenders need to offer to sell them. Second, prepayment risk is elevated because so many borrowers locked sub-3% rates in 2020-2021 and will not refinance until rates fall meaningfully, making each new mortgage's expected life shorter and harder to price. Third, mortgage origination volumes have been weak, which has reduced economies of scale at servicers and raised the operating-cost component of the spread.
Where do major forecasters expect mortgage rates to go in 2026?
The consensus across Fannie Mae, the MBA, NAR, NAHB, Wells Fargo, and Morgan Stanley sees the 30-year fixed declining gently through 2026, with year-end forecasts clustered between 5.75% and 6.30%. The mean of these forecasts puts the rate near 6.1% by Q4 2026 (The Mortgage Reports).
The 2026 forecast table from public statements:
| Forecaster | Q2 2026 | Year-end 2026 | Tone |
|---|---|---|---|
| Fannie Mae | 5.90% | 6.10% | Moderately bullish |
| National Association of Home Builders | 5.99% | n/a | Moderately bullish |
| National Association of Realtors | 6.00% | n/a | Moderately bullish |
| Wells Fargo | 6.15% | n/a | Centrist |
| Mortgage Bankers Association | 6.30% | 6.20% | Centrist |
| Morgan Stanley | n/a | 5.75% | Most bullish |
| Bankrate Q2 average | n/a | 6.0% to 6.2% | Centrist |
A few notes on reading this table:
- The "moderately bullish" calls (5.75% to 6.0% by Q4) all assume the Fed continues to cut and inflation continues to moderate. If either assumption breaks, the rates likely sit closer to the centrist end.
- The MBA at 6.30% Q2-2026 is the most conservative public call. The MBA has been consistently more bearish than Fannie Mae on rate trajectory and has been roughly right on direction since 2023.
- Morgan Stanley's 5.75% year-end is the most bullish institutional call. It depends on a meaningful narrowing of the mortgage-to-Treasury spread back toward 2 to 2.5 percentage points, which has not yet started in earnest.
The honest summary: every major forecaster sees rates lower at year-end than they are today, but none sees a return to 4-something rates in 2026. Anchor your planning to a 5.75% to 6.30% range, not to a specific point estimate.
What does a 1% mortgage rate drop actually save you?
On a $400,000 30-year fixed mortgage, dropping the rate from 6.5% to 5.5% reduces the monthly payment by about $260 and the lifetime interest cost by about $93,400. On a $500,000 mortgage the monthly savings is about $325 and the lifetime savings about $117,000 (FRED).
The worked example for a $400,000 loan, 30-year fixed, principal and interest only:
| Rate | Monthly P&I | Lifetime interest paid | Annual interest paid (year 1) |
|---|---|---|---|
| 7.5% | $2,797 | $607,000 | $29,800 |
| 6.5% | $2,528 | $510,000 | $25,800 |
| 5.5% | $2,271 | $417,000 | $21,800 |
| 4.5% | $2,027 | $330,000 | $17,800 |
What the numbers say:
- Each 1-percentage-point move is roughly $250 per month at the $400K loan size. The mortgage payment is roughly linear in the rate over the 4.5% to 7.5% range.
- Each 1-percentage-point move is roughly $90,000 in lifetime interest at the same loan size. The lifetime number is dramatic because 30 years of compounding does most of the work; the monthly number is what matters for affordability.
- Doubling the loan size doubles both numbers. A $200K loan saves $130 per month on a 1% drop; an $800K loan saves $520.
Does waiting for a better rate actually pay off?
It depends on what happens to the home price while you wait. The same $400,000 loan, financing a $500,000 home, with a 1% rate drop saving $3,100 in interest in year one, is offset by a 0.6% home-price appreciation ($3,000). Anything more than that offsets the rate savings entirely.
A simple "wait vs buy" worked example for the same $500,000 target home:
- Buy now at 6.5%: $400,000 loan, $2,528/month, total cost in year 1 = $30,300 interest paid into the loan.
- Wait 12 months, buy at 5.5% but home price 4% higher: $416,000 loan (4% larger because the home now costs $520,000 and the down payment is unchanged at $100,000), $2,361/month at 5.5%, year-1 interest paid = $22,700.
- Net savings from waiting: about $7,600 in year-1 interest, BUT you also paid $20,000 more for the asset itself.
- Break-even: the rate needs to drop more than 1% over the year, or home prices need to fall (not rise), for waiting to net out.
The point is not that waiting is wrong. The point is that the rate is one variable in a multi-variable decision. The single largest variable in most US markets in 2026 is housing supply, which has been tight enough that price appreciation has more or less absorbed the rate-driven savings.
Should you wait for lower mortgage rates before buying?
No, not as a stand-alone reason. The right framework is to buy when the monthly payment is comfortable and refinance later if rates drop. You can refinance the rate at any time; you cannot refinance the purchase price. (Bankrate).
The case-by-case version:
- First-time buyer with a stable job: buying at 6.36% on a home you can afford is usually better than waiting for 5.5%, because home-price appreciation in tight US markets has been keeping pace with the rate savings, and the refinance option is always available. The exception is a market with a clear supply build-up where prices may actually fall.
- Refinance candidate with a 7.5%+ rate from 2023: any sustained move to 6.0% or lower is a meaningful refinance trigger. The rule of thumb is that a 75-basis-point drop pays for typical $4,000 to $6,000 closing costs within 18 to 30 months. At today's 6.36%, a 7.5% borrower would save about $185/month on a $400K loan, recouping closing costs in roughly 24 months.
- Move-up buyer locked at 3% from 2021: the math is harder. Trading a sub-3% mortgage for a 6.36% mortgage on a bigger home requires either a clear life-stage need (more space, school district, job relocation) or a meaningfully lower home price. Many of these buyers stay put longer than they otherwise would, and that is a rational response to the rate environment.
- Cash buyer or large-down-payment buyer: the rate matters less because the loan size is smaller. A $200K loan at 6.5% costs $1,264/month; the same loan at 5.5% costs $1,135. The $129/month difference is small enough that lock-vs-float decisions are usually driven by other factors.
What's the smartest way to track mortgage rates yourself?
Three sources are worth checking weekly. The Freddie Mac PMMS publishes Thursday morning and is the canonical rate. Mortgage News Daily updates a daily rate average that lags or leads PMMS by a day or two and is useful for catching mid-week moves. The 10-year Treasury yield, available free at the Federal Reserve or any financial-data site, is the leading indicator: if the 10-year moves 20 basis points, the 30-year mortgage typically follows within a week.
For more on what drives interest rates broadly and why the relationship to Fed policy is indirect, see when will interest rates go down. For how the mortgage rate translates into the credit score and program you need to actually qualify, see what credit score is needed to buy a house and is APR the same as interest rate. To anticipate the next policy move, see when the next Fed interest rate decision is scheduled.